


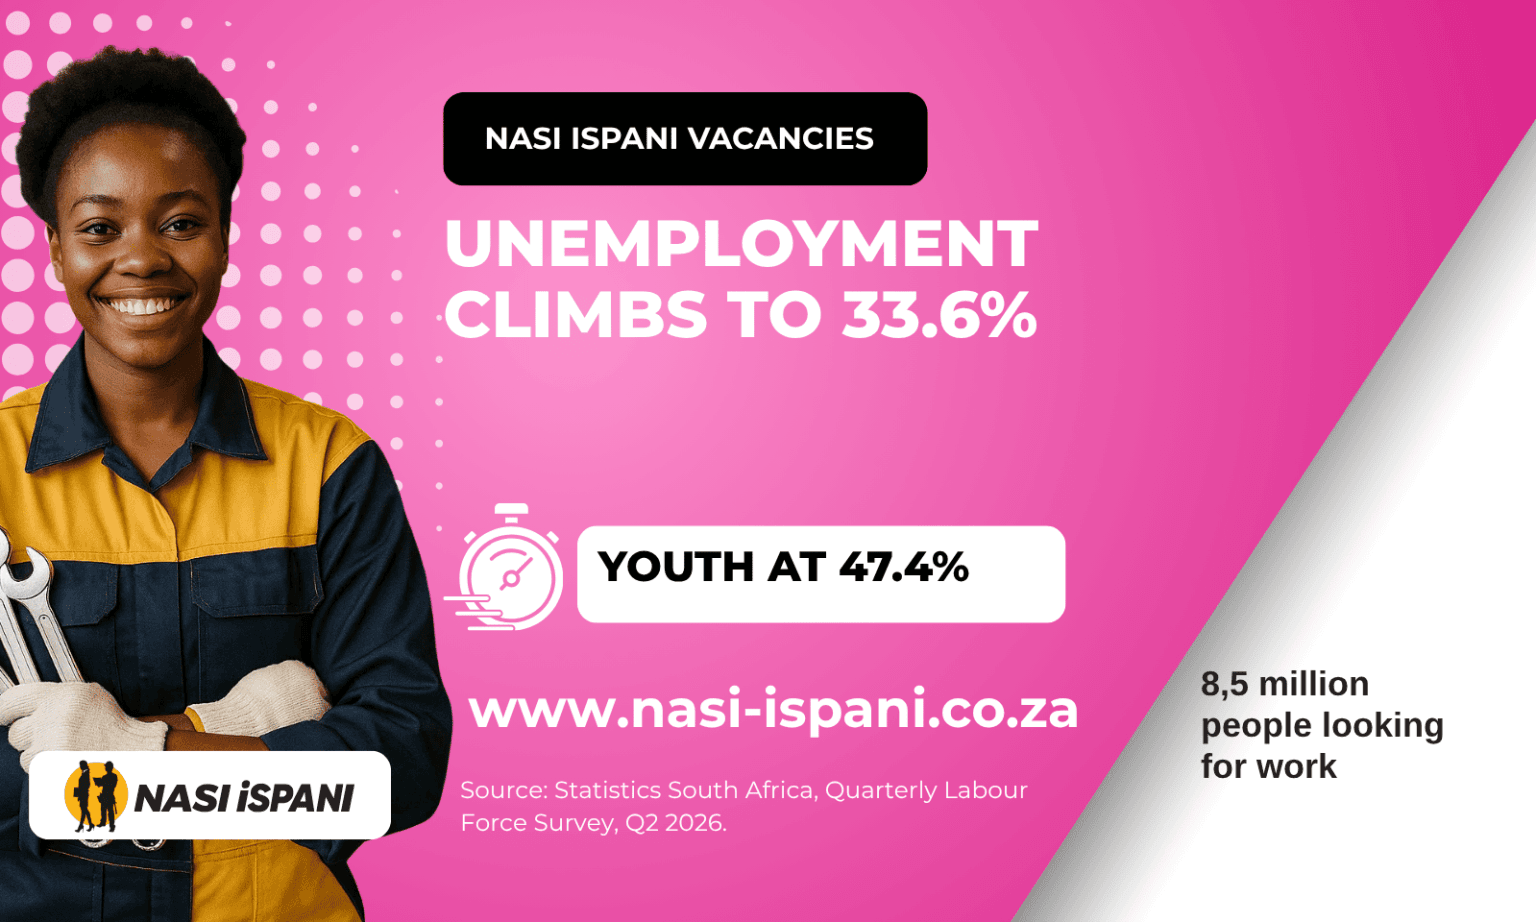
A clip from eNCA doing the rounds on TikTok this week asks the question a lot of people are asking out loud: South Africa’s unemployment rate has climbed to 33,6%, the highest reading since 2022, so why are jobs still so hard to create, and why is growth still so weak?
The figures come from Statistics South Africa’s Quarterly Labour Force Survey for the second quarter of 2026, released on 11 August 2026. Below is what the survey actually says, what the different unemployment rates mean, which provinces and sectors moved, and what it changes, and does not change, if you are the one looking for work.
The headline numbers
Between the first and second quarters of 2026:
| Measure | Q1 2026 | Q2 2026 | Change |
|---|---|---|---|
| Official unemployment rate | 32,7% | 33,6% | +0,9 pp |
| People unemployed | 8,2 million | 8,5 million | +345 000 |
| People employed | 16,7 million | 16,7 million | −16 000 |
| Expanded rate (LU3) | 43,7% | 43,8% | +0,1 pp |
| Youth rate (15–34) | 45,9% | 47,4% | +1,5 pp |
Read the third row again, because it is the one that explains the rest. Employment did not collapse, it fell by 16 000, which on a base of 16,7 million is close to flat. The rate rose mainly because 345 000 more people were counted as actively looking for work. When the number of people searching grows faster than the number of jobs, the percentage goes up even when employment barely moves.
Three different rates, three different questions
You will see 33,6%, 43,8% and 47,4% quoted in different places this week. They are not competing versions of the truth, they answer different questions.
33,6% is the official rate. It counts you as unemployed only if you did not work in the reference week, were available to work, and actively looked for work or tried to start a business in the four weeks before the survey. “Actively looked” means something specific, sending applications, going to a company, answering adverts, asking around for work.
43,8% is the expanded rate. It adds the people who want a job and are available, but did not search in that four-week window. Stats SA calls them discouraged work-seekers. Someone who has run out of taxi fare to hand in CVs, or who has stopped applying after two years of silence, sits in this group. This is the number that best describes how many people in South Africa want work and do not have it.
47,4% is the youth rate, for everyone aged 15 to 34 on the official definition. In the second quarter there were 5,0 million unemployed young people, an increase of 264 000, while youth employment fell by 40 000 to 5,6 million.
None of this is a measure of how hard anyone is trying. If you have been applying for months without a reply, you are inside a national number, not an exception to one.
Where the jobs went
The quarter’s movement was not evenly spread. By sector:
- Formal sector: down 41 000
- Private households: down 9 000
- Informal sector: up 34 000
That combination matters more than the totals suggest. Formal jobs usually come with a contract, UIF, a payslip and some protection. Informal work often does not. The quarter therefore shifted a slice of employment from the more secure category to the less secure one, even though the headcount looks close to flat.
By province, employment rose in Mpumalanga (+41 000), the Eastern Cape (+13 000) and the Free State (+9 000), and fell in the Western Cape (−48 000), Gauteng (−22 000) and North West (−15 000).
The unemployment rate by province tells a harsher story than the job gains do, because the size of each province’s labour force differs so much:
| Province | Official unemployment rate, Q2 2026 |
|---|---|
| Western Cape | 19,5% |
| Northern Cape | 28,7% |
| Limpopo | 32,0% |
| KwaZulu-Natal | 32,5% |
| Gauteng | 34,6% |
| Mpumalanga | 36,6% |
| Free State | 37,3% |
| North West | 38,1% |
| Eastern Cape | 47,5% |
The Eastern Cape is the outlier: 47,5%, up 2,9 percentage points from 44,6% in the first quarter. Close to one in two people in that province’s labour force is looking for work and cannot find it.
Why jobs are still so hard to create
This is the question the eNCA clip put on the table, and the honest answer is that no single cause explains it. What the survey itself shows is worth separating from opinion.
What the data shows. The labour force is growing faster than the economy is adding jobs. Employment was essentially flat while 345 000 more people started searching. The formal sector, the part that creates jobs with contracts and benefits, shrank, while the informal sector absorbed some of the difference. Job losses concentrated in the two largest provincial economies, Gauteng and the Western Cape.
What that implies. An economy adding jobs slowly is not the same as an economy shedding them. South Africa’s problem in this quarter was not mass retrenchment; it was that the number of new entrants and returning searchers outpaced what the economy produced. That gap is structural. It is the accumulated result of slow growth, an education-to-work pipeline that does not match employers’ requirements, and the cost and distance of looking for work in the first place. It is not the product of individual effort, and it will not be closed by individual effort alone.
That last point is worth being blunt about, because the tone of a lot of jobs coverage suggests otherwise. When almost half of young South Africans in the labour force are unemployed, that is a description of the economy, not of the people in it.
What it changes if you are job hunting
You cannot control the national rate. You can control how far your application gets before a human ever sees it, and in a market this crowded that is where most applications die.
Three things are worth your time this month.
1. Get past the software first. Large employers filter CVs through applicant tracking systems before anyone reads them. If your CV is a scanned image, a fancy two-column template, or missing the exact words in the advert, it can be screened out with no human involved. Run yours through our free ATS Resume Scanner and fix what it flags, it takes a few minutes and it is the single highest-return thing most job seekers can do. If you want the reasoning behind it, this guide explains how applicant tracking systems reject CVs and how to fix yours, and this one covers what recruiters actually look at in the first ten seconds.
2. Add a skill you can prove. With formal jobs contracting and competition rising, a certificate you can name on a CV moves you ahead of an identical application without one. The Nasi iSpani Academy is free, works on a phone, and each course takes under an hour, Work-Ready Essentials for interviews and workplace basics, Computer Basics if you need the fundamentals, and AI Skills for Work, which is the fastest-moving thing most employers are now asking about. There are also free short courses you can finish in under ten hours and high-income skills you can learn for free.
3. Register where the opportunities are pooled. A lot of youth-targeted programmes recruit from databases rather than adverts, so registering once puts you in a pool you cannot reach by applying job-by-job. Start with the NYDA database for unemployed graduates, the Harambee Youth Employment Accelerator, and the National Youth Service Phase V, which is recruiting 100 000 participants. Our full guide to NYDA programmes covers what else you qualify for.
If you have no formal work history yet, do not leave the experience section blank, these ten everyday activities legitimately count as work experience and belong on your CV. And if you do not have a CV in a usable format at all, the free CV Builder builds one from your details in a few minutes.
How to check the numbers yourself
Labour figures get repeated quickly and badly on social media, often with the quarter stripped off, which is how a 2022 number ends up being shared as this week’s news. The primary sources are free and public:
- Stats SA media release: Quarterly Labour Force Survey, Q2 2026, the official summary of everything quoted above.
- The full QLFS Q2 2026 statistical release (PDF, P0211), the complete tables, including provincial and industry breakdowns.
- SAnews: SA official unemployment rate rises to 33,6%, the government news agency’s report on the release.
When you see a labour statistic quoted anywhere, check three things: which quarter it covers, whether it is the official or the expanded rate, and whether it is the national figure or a provincial one. Most misleading posts fail on at least one.
Frequently asked questions
What is South Africa’s unemployment rate right now?
The official unemployment rate was 33,6% in the second quarter of 2026 (April to June), up from 32,7% in the first quarter. This is the most recent figure published by Stats SA, released on 11 August 2026.
Why do some reports say 43,8% instead?
That is the expanded rate, which includes discouraged work-seekers, people who want a job and are available but did not actively search in the four weeks before the survey. The official rate excludes them. Both come from the same survey.
What is the youth unemployment rate in South Africa?
47,4% for people aged 15 to 34 in the second quarter of 2026, up 1,5 percentage points from the previous quarter. That is 5,0 million unemployed young people.
Which province has the highest unemployment?
The Eastern Cape, at 47,5% in the second quarter of 2026, up from 44,6% the previous quarter. The lowest is the Western Cape at 19,5%.
Did South Africa lose jobs this quarter?
Slightly. Employment fell by 16 000 to 16,7 million. The rate rose mainly because 345 000 more people entered or re-entered the search for work, which grows the labour force faster than employment grew.
Is 33,6% the highest it has ever been?
No. It is the highest reading since 2022. The official rate peaked at a record 35,3% in the fourth quarter of 2021, the highest since the Quarterly Labour Force Survey began in 2008, before easing over the following years.
The bottom line
South Africa’s labour market did not fall off a cliff this quarter, it stood still while more people arrived looking for work, and the composition of the jobs that exist tilted a little further towards the informal. That is a structural problem with structural causes, and it is going to be solved at the level of policy and growth, not willpower.
What is inside your control is narrower but real: a CV that survives the software, one more provable skill than the person next to you, and your name in the databases that programmes actually recruit from. Start with the free Academy, seven courses, all on your phone, no data-heavy downloads.